Charts That Matter 2018
Featured


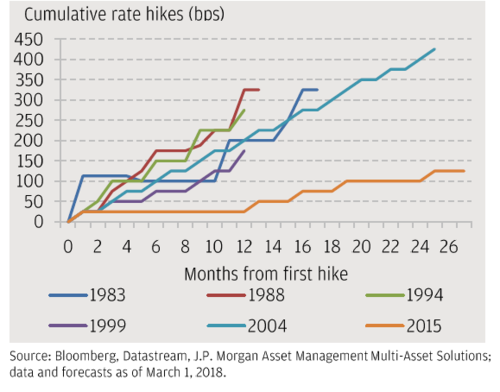

FEDERAL RESERVE RATE HIKES
Rounding-out their 2018 Federal Open Market Committee (FOMC) meeting schedule, the Fed hiked the federal funds rate by 25 basis points (bps) at their mid-December meeting to an upper bound of 2.50%, the fourth hike of 2018 and the eighth hike in their current tightening campaign.
2018 has proven to be a tough year for asset classes across the board. With 93% of global assets delivering a negative return year-to-date, 2018 is the worst year on record for this measure.
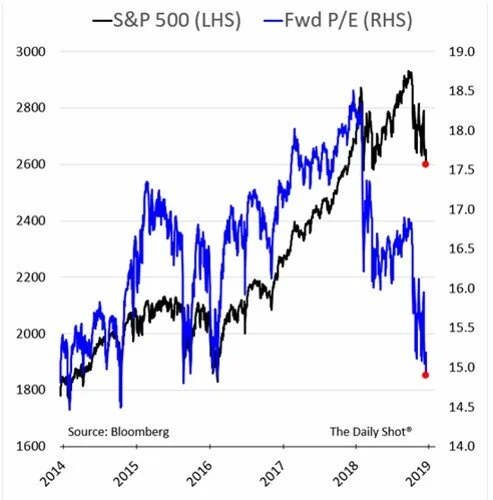
The S&P 500 Index’s Forward P/E ratio has hit multi-year lows as it remains in correction territory (down over 10% from record highs).
Shares of several U.S. companies have rallied following recent announcements of increased share repurchases, a welcome development for investors bruised by recent market volatility.
While some believe higher volatility brings better opportunities for market timing, such efforts face a high bar relative to just staying invested. Missing the best months in equities, which are often after drawdowns like those experienced in February and October of 2018, lowers holding period returns materially.
Equity and credit valuations are below 1990s average levels again. Equity valuations have de-rated due to a combination of price declines and still positive earnings growth.
For the first time since 2015, global equities have underperformed bonds in 2018 year-over-year.
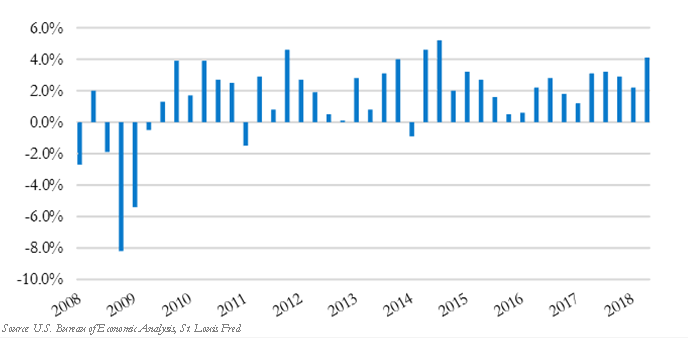
Economists expect third-quarter gross domestic product (GDP) to come in at a 3.4% annual growth rate this week. If met, this would add up to the best back-to-back quarters since 2014 following the second quarter’s +4% growth rate.
Through August, the number of job openings increased to the highest on record, at 7.136 million. There are approximately 1.2 million more job openings than unemployed persons, potentially indicative of a lack of skilled available labor capital and/or a skills mismatch inherent in the labor force
The benchmark S&P 500 index has risen in seven of the past nine earnings seasons, climbing on average 1.7% during the four weeks after big banks kick off the reporting period, according to Dow Jones Market Data. Even more encouraging is that in three of those periods, the S&P 500 had fallen in the four weeks leading up to earnings season. In other words, it’s not unusual for the equity markets to go through a period of weakness before earnings season. With analysts projecting a 21% growth rate in earnings for the third quarter, we expect this trend to continue.
Nominal yields jumped on Wednesday with the 10-year U.S. Treasury yield touching 3.23%, a significant 14bp move in a 24-hour period. After retreating slightly, at time of writing yields have moved higher again reaching 3.24%, their highest level since February 2011
The U.S. economy is growing at the quickest pace in over four years and, therefore, keeps raising the bar for economist’s expectations. The Citigroup Economic Surprise Index, a measure of whether economic reports are meeting projections, has fallen to its lowest level in nearly a year in the U.S. The gauge has dropped into negative territory, indicating releases are broadly starting to come in below expectations. At the same time, we are seeing a rebound abroad where expectations have been depressed.
The U.S. economy grew at the strongest pace in nearly four years during the second quarter. Gross domestic product (GDP) – the value of all goods and services produced across the economy – increased at a 4.1% annualized rate in the second quarter.
The pure duration of the bull run is impressive but not particularly surprising given the magnitude of the recession that the U.S. has rebounded from. From a return perspective, however, the bull market currently ranks in 8th place in terms of annualized returns.
The current bull market began on March 9th, 2009 when the S&P 500 was as 676 points. 9 ½ years and 323 percent later, the S&P 500 officially set the record for the longest bull market run on Wednesday. With double digit earnings growth paired with strong economic growth, there should be room for it to extend this record.
Trade war concerns, continued tightening of U.S. monetary policy, and more recently an appreciating USD, have weighed on emerging market assets in 2018. Continued USD strength may complicate government funding for those economies that rely heavily on external debt to finance their economy. Across the emerging markets, the IMF estimates that external debt total servicing costs are near 10% of GDP, which, is above long-term average levels, but below peak levels witnessed in 2015
With a strong second quarter growth rate, investors are now turning their attention to the third quarter. Retail sales, released last week, provide a good omen with a strong 0.5% monthly growth rate; suggesting consumers remain healthy which should provide continued support for economic growth
Conference Board Leading Economic Index (LEI) data for June was released last week and showed that the LEI increased 0.5% month-over-month. The index level increased to 109.8 in June, a new cycle high. As the name of the index suggests, this composite of indicators is designed to lead the business cycle, with recent solid growth supportive of near-term economic gains and implying a business cycle still exhibiting an expansionary bias.
Broad strength across all sectors are expected for second quarter earnings season with Energy leading the way.
Rallying oil prices, strong U.S. economic data and buoyant consumer confidence have pushed analysts’ earnings estimates higher since the start of the second quarter.
Equity markets continue to be conflicted between the benefits of tax reform and the turbulence of tariffs.
Just four stocks have fueled over 82% of the S&P 500’s 2.6% gain on a year-to-date basis through June 30th. Excluding these stocks, the S&P 500 would only be up 0.48%. Excluding the top seven stocks, the S&P 500 would be in negative territory for the year. During an average year, the 10 stocks with the greatest impact typically account for only 45% of the market’s price moves.
The proposed tariffs - if implemented in full - would increase the average effective US tariff rate by about 5 percentage points (pp) and take the US back to levels last seen in the 1970s.
Counting the tariffs. So far, duties on $55.7 billion of imports have been implemented, including tariffs on washing machines and solar panels, steel and aluminum. A first round of tariffs on $34 billion of imports from China is set to take place on July 6th unless an agreement is reached. From here, President Trump has threatened three further steps: a 25% tariff on an addition $100 billion from China, 20% on $275 billion of auto imports and 10% on an additional $300 billion from China.
The Federal Open Market Committee will be announcing their next policy decision tomorrow. Another rate hike is nearly fully priced into the markets with a probability of 84%.
The Atlanta Fed’s GDPNow model forecast for second quarter economic growth remains above 4.5%. Even if the model is overestimating growth by 1%, the second quarter is staging an impressive rebound.
Politics continue to cause uncertainty and angst for the markets as they dominate the headlines. Most recently, the announcement of new governments in Italy and Spain and the implementation of steel and aluminum tariffs on some of our largest trading partners, including Canada, Mexico and the European Union.
While the Federal Reserve is increasing interest rates in the U.S., this rate hiking cycle is set to be the longest and shallowest on record.
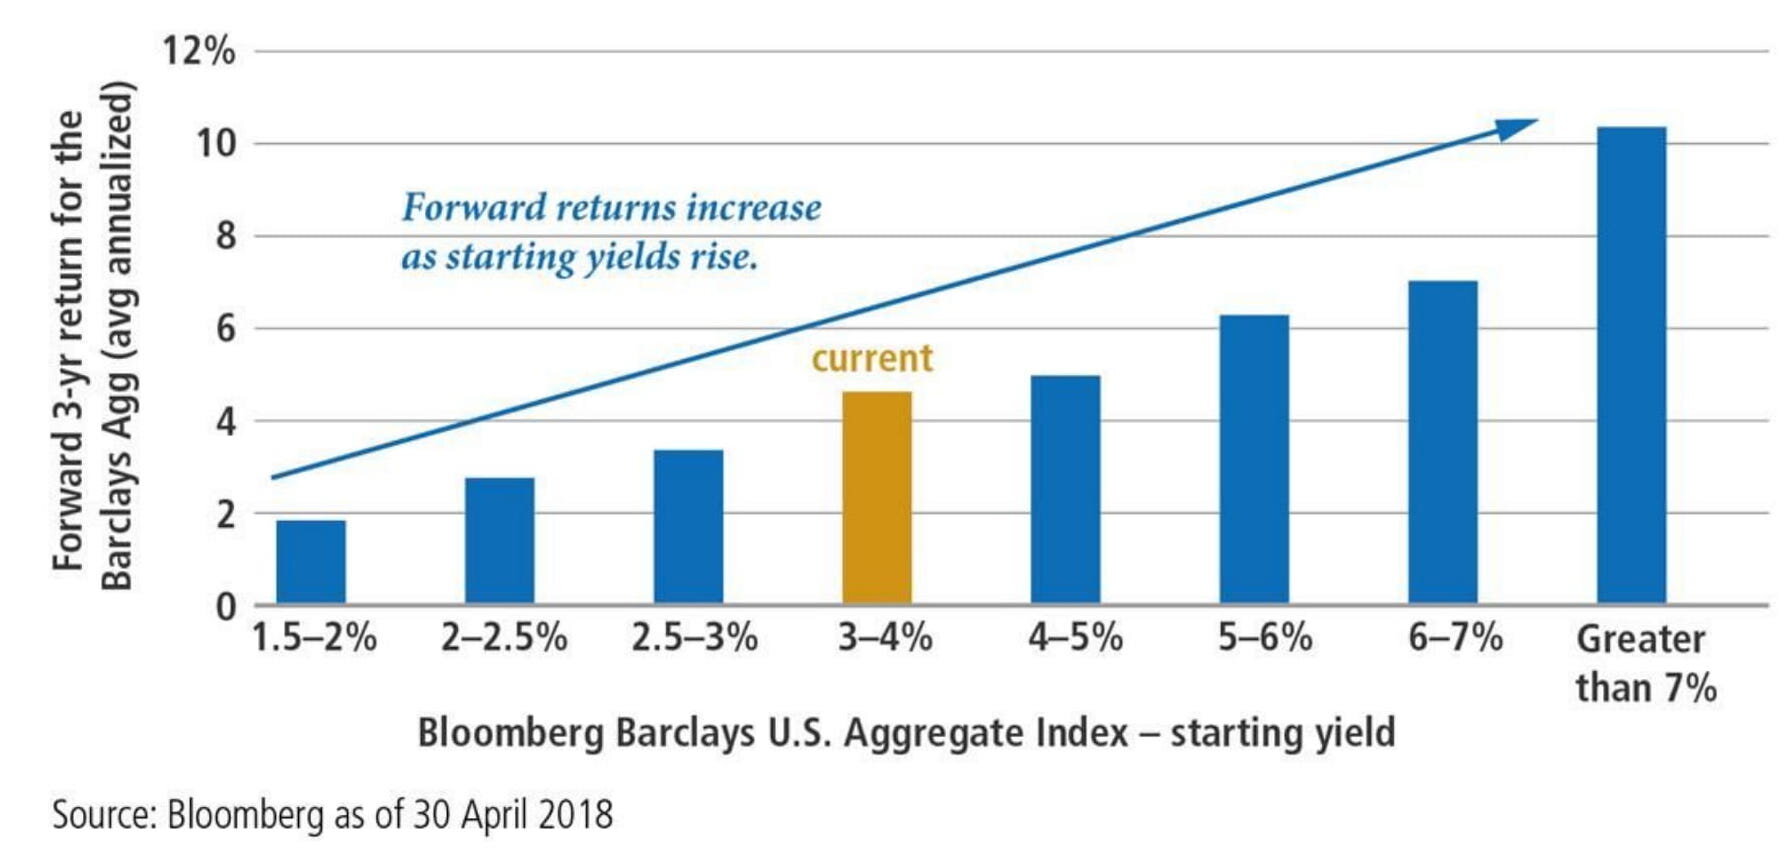
The 10-year U.S. Treasury Yield has firmly breached the headline-grabbing 3% threshold to 3.1% - the highest level since 2011. It is important to remember that rising rates – although painful over the short-term as bond prices move inversely to yields – are beneficial to fixed income investors over the long-term.
This month, the current U.S. economic expansion reaches the 107-month mark, making it the second longest economic expansion on record. The next milestone is 13 months from now – June 2019 – at 120 months and it is looking increasingly likely that this expansion will continue for more than a year and set the new record.