Charts That Matter 2019
Featured


Multiple economic models showed recessionary risks increasing throughout 2019 but have recently started to retreat. It appears that they will continue to come down from the elevated levels as the global economy is poised to continue to grow into 2020. Low inflation, easy monetary policy, robust consumer spending and a relatively strong global services sector combine to propel economic growth forward into the New Year.
The markets continue to climb the proverbial “wall of worry” as illustrated through investment flows amongst asset classes. Individual investors have pulled a record amount out of the equity markets this year despite the S&P 500 Index on pace for the best year since 2013. The equity markets have experienced seven consecutive quarters of net outflows; with these outflows accelerating significantly in the fourth quarter of 2018 (in the midst of the drawdown experienced - the timing could not have been worse; meaning most retail investors sold at the worst time and have not benefitted from the rebound we have experienced this year). This continues to be one of the most unloved bull markets in history.
Value stocks have staged quite the comeback over the past three months as the S&P 500 Value Index has delivered a return twice that of the S&P 500 Growth Index. Even after this brief stretch of outperformance, valuations for value stocks remain at their most attractive level in years relative to growth stocks.
Small business optimism increased more than expected in October, rising from 101.8 up to 102.4 compared to economist expectations for an increase to just 102.0. After a sharp drop from its high in August 2018, small business sentiment hasn’t rebounded much off its lows, but it is at least showing some sign of optimism.
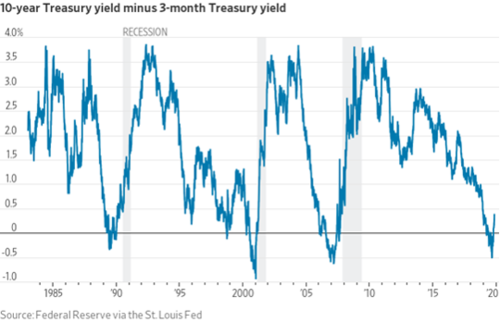
Earlier this year, longer-term yields fell below shorter-term yields leading to what is known as an inverted yield curve. In late August, the 3-Month Treasury Bill yielded 0.5% more than the 10-Year Treasury Note. We have since seen a normalization of the yield curve as it completely uninverted last week for the first time since November 2018 - a positive sign for investors.
The valuation levels of European stocks are significantly cheaper than that of U.S. stocks; a reflection of the market pricing in the ongoing political risks (e.g. Brexit) and growth concerns. Reversion to the mean is a powerful force. Should we begin to see a turnaround in macro data out of Europe, this reversion may begin to take hold with the market favoring International equity markets over U.S.
Some investors associate safety with a stock that pays a hefty dividend yield. While the income potential might be attractive, it is always important to look at investments from a total return perspective which includes both price return and income return. As shown in this chart, stocks within the S&P 500 Index that pay the highest dividend are among the biggest decliners in terms of price over the past year. One can always “create their own dividend” by trimming the price appreciation of a stock that might not pay as much income.
While the third quarter ended on a relatively quiet note, with the S&P 500 Index eking out a modest gain of 1.2%, it was a dizzying three months underneath the surface across the equity and fixed income markets. The chart illustrates the one of the key roles of fixed income in a portfolio – providing ballast in times of equity market stress – as yields fell sharply in August (yields fall, bond prices rise) in conjunction with the drawdown experienced in the equity markets.
The growth trade that has worked so well for investors this year – and over the course of this bull market run – has come under pressure over the past few weeks with value staging an impressive 4.1% outperformance streak since August 27th.
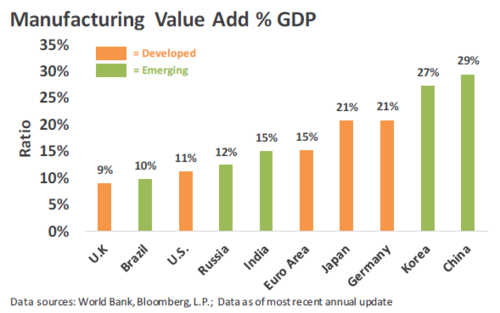
Elevated global trade tensions, particularly between the U.S. and China, have led to significant weakness across the global manufacturing sector since early-2018. Thankfully, most global service sector gauges remain in expansionary territory, with the U.S. Services Purchasing Manufacturer’s Index coming in at 56.4 for August. It is important to remember that the U.S. economy is a consumer based economy and manufacturing comprises a relatively small share of overall U.S. GDP as shown in the chart below.
Staying invested in times of market stress is illustrated here. The chart shows different dates an investor could have switched their portfolio to cash in the late 2018 correction. The outcome that resulted in the highest ending balance was staying invested.
Tariffs on consumer products were pushed back to commence September 1st and December 15th for different product categories. To this point, tariffs on China have not been necessarily on broad categories of consumer products as the ones coming up are set to be. U.S consumers would likely notice higher prices should these tariffs go into effect.
The Federal Reserve lowered their target rate for the first time since 2008. Each of the two last times that interest rates were cut, a recession and many more rate cuts followed. This time, the U.S economy is strong on its own but global threats loom overhead.
The next round of tariffs that have been threatened by President Trump will have the most impact on consumer goods.
With little progress being made on ending the trade war, imports of U.S. soybeans by China have dropped to the lowest level since 2004 at just over 5 million tons. To put this in context, China imported soybeans at a rate of 3.2 million tons a month in the first half of 2017.
Another sign of strength by the U.S. consumer was revealed in the Retail Sales report showing retail sales rising for the fourth consecutive month. The Retail Sales report covers the durable and nondurable portions of consumer spending and highlighted the broad based spending across categories by the consumer.
Consumer spending is estimated to grow at a 4.3% annual rate in the second quarter – the fastest pace since 2014 – according to forecasting firm Macroeconomic Advisers. The U.S. is a consumer based economy – with consumption accounting for approximately 70% of economic growth. The strong growth in spending bodes well for continued expansion in the second half of 2019 and into 2020.
Earnings headwinds have been plentiful – stronger dollar, lower oil prices and continued uncertainty regarding trade to name a few. More than 80% of S&P 500 companies that have revised their profit estimates one way or the other in the lead-up to reporting have slashed them, data compiled by Bloomberg show. Analyst estimates now call for a 2.5% drop in earnings for the second quarter. Unless companies exceed analyst earnings estimates, this would mark the first profit contraction in three years.
The IHS Markit Eurozone composite purchasing managers’ index (PMI) – used to gauge the direction of economic trends in the manufacturing and service sectors - strengthened to 52.2 in June, up from 51.8 in May, for the Eurozone. June’s PMI reading is the highest level since November 2018, signaling a pick-up in economic growth for the area. Most of the growth was driven by expansion in the services sector; helping to offset the downturn in manufacturing activity that continues to be dampened by tariff threats.
Consumer items have largely been spared by tariffs thus far into the trade war. Should the U.S. proceed with imposing tariffs on an additional $300 billion, there will be few items spared as illustrated in the change from current percentage of imports subjected to tariffs on the left to the percentages on the right under the proposed increase in tariffs.
University of Michigan’s Survey of Consumers for June showed that survey respondents voiced concerns over tariffs, which may negatively impact growth and inflation. The 5-10 year inflation estimate from the survey declined to 2.2%, the lowest on record.
The Conference Board’s Leading Economic Index (LEI) level increased to a new cycle high through April. However, annualized growth in the index slowed to 2.7% - the weakest growth rate since 2017. A further slowdown in the rate of improvement bears watching.
Trade tensions between U.S. and China have been renewed as the U.S. increased tariffs to 25%, from the previous rate of 10%, on $250 billion of Chinese imports last Friday. Tech-related imports are facing the largest impact from the increased tariffs.
Economic growth in the U.S. – as measured by Gross Domestic Product (GDP) – beat estimates by a wide margin in the 1st quarter as the economy expanded at an annualized pace of 3.2% for the quarter versus the 2.3% Bloomberg consensus estimate. Contributions to growth were experienced across each major category of GDP.
Analysts became extremely pessimistic on their outlook for earnings growth in the midst of the 2018 market selloff; with downward revisions to their earnings growth estimates throughout the fourth quarter. With a majority of companies exceeding estimates for first quarter earnings across the globe, analyst are now revising their pessimism and therefore earnings outlook.
China led a rebound in manufacturing activity across Asia during March. The IHS Markit manufacturing purchasing managers’ index rebounded to 50.5 from 49.2 for China – the largest increase since 2012. Levels above 50 indicate expansion. Additional evidence is needed to confirm whether or not the economies across Asia are stabilizing.
Fourth quarter GDP growth was revised down from the initial 2.6% estimate to 2.2% as government and consumer spending were less than originally estimated. This final estimate for the fourth quarter brings economic growth for the full year of 2018 to 3%; the fastest pace since 2005.
On March 22nd, the yield on the U.S. 10-year Treasury note dipped below the yield on the three-month paper. While an inverted yield curve often precedes a recession, not all inverted yield curves lead to a recession. Furthermore, while it may be a recessionary signal, it tells us nothing about the timing of such recession. See Legacy’s Insight Piece, “Inversion of the U.S. Bond Yield Curve” for additional commentary.
In February, Fed Chair Jerome Powell reiterated the case for a patient interest-rate policy given “muted” inflation pressures and slowing global growth as a risk to their outlook. The market now expects zero hikes in 2019 relative to the Fed’s projection of two hikes in 2019.